Service Performance
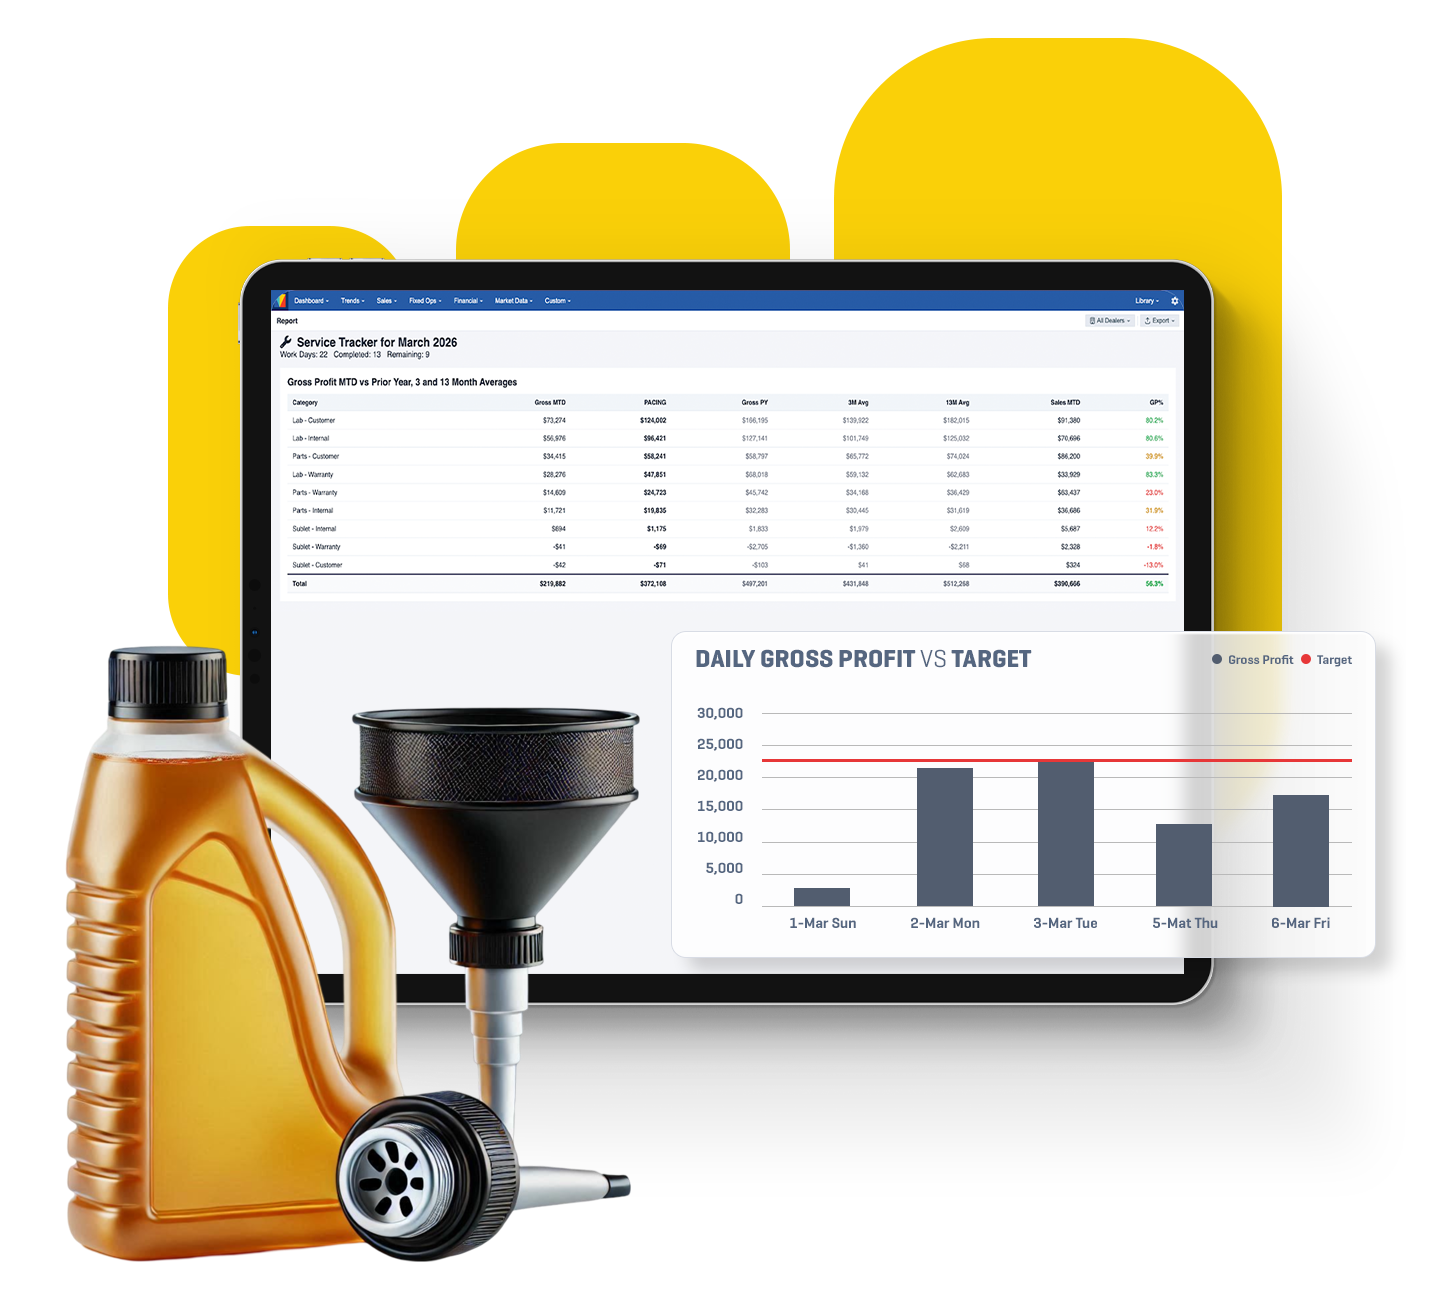
Gross profit, RO count, ROs per day and labor rate updated daily.

Real‑time insight into service gross, productivity, capacity and CSI — so you can increase revenue, control costs and deliver better customer experiences.
Bumper BI surfaces what's happening in your shop as it happens. Monitor gross profit, ROs per day and effective labor rate in real time. Track advisor and technician productivity. Identify bottlenecks in shop capacity. Control warranty and internal work before it kills your gross.
Key Capabilities
Gross profit, RO count, ROs per day and labor rate updated daily.
Measure advisor and tech hours sold versus billed; spot coaching opportunities.
Manage labor utilization and shop capacity to maximize throughput.
Identify warranty claims, comeback rates and cycle time to protect gross and satisfaction.
Total Gross
$1,264,830+5.4% vs YesterdayRO / Day
98.6+8.7% vs YesterdayAvg Repair Order
$615+4.1% vs YesterdayCustomer Pay %
74.5%+2.0% vs YesterdayEffective Labour Rate
87.2%+1.6% vs YesterdaySee advisor drift, labor misses, and RO changes before month-end.
Create a cleaner operating cadence for fixed ops leaders.
Turn service activity into predictable profit movement.